
Eu já fiz dois cursos de linguagem R (em poucas palavras, linguagem R é a programação mais usada no mundo para análise econométrica). É muito prático e gratuito na Internet.
Uma econometrista anônimo (ele não quis divulgar seu nome, talvez com muito receio de perseguição ) usou linguagem R para mostrar que houve desvios ilógicos econometricamente, na contagem de votos entre Biden e Trump, o que seria forte indicio de fraude nas eleições.
Ele divulgou os dados excel o e também"script" (os passos analiticos que ele fez pada chegar a essa conclusão). Qualquer um pode refazer, checar os resultados e mudar os parâmetros.
Não tenho tanta formação para tal, precisaria trabalhar com isso (econometria além de curso é preciso trabalhar diariamente para não se perder a prática). Mas conheço alguns amigos que possuem.
Em todo caso, claro, econometria não é ciência exata, nem mostra relação de causa e efeito. Apesar de alguns econometristas acharem que sim, hehehe. Mas falar de "ilógico econometricamente" é muito pesado.
Mas vale a análise.
Aqui vai o resumo da parte interessante e picante dos resultados: mudança radical de padrão de voto em Wisconsin, não explicada pelos dados históricos. Mudança completamente anômala na Pensilvânia que não ocorre em nenhum lugar do resto do país e mostra sinais de falsificação de datas. A votação da Geórgia desafia a lógica. Em Michigan, os dados combinam a estranheza que ocorre em Wisconsin mais a falta de lógica de Geórgia e Pensilvânia. E Virgina que também é anomala na votação mas que ainda não teve acusação de fraude.
Ele conclui dizendo:
"Vamos concluir isso: parece que os democratas deram um tiro no pé, ao fazer com que todos votassem pelo correio, na verdade, torna mais fácil detectar fraudes nas cédulas. Todas as cédulas passam pelo sistema postal, elas são embaralhadas como um baralho de cartas, então esperamos que o retorno da cédula seja extremamente UNIFORME em termos de razão D vs R, mas desviam ligeiramente para R ao longo do tempo porque algumas dessas as cédulas vão mais longe. Esse padrão prova fraude e é um carimbo de data / hora verificável de quando cada ação fraudulenta ocorreu."
Vejam texto original dessa parte picante:
Now let's look at some anomalies:
This is the Wisconsin vote counting history log. Again, on the Y axis we have the ratio of D to R ballots in reporting batch, and on the X axis we have reporting time. Around 4am there, there is a marked shift in the ratio of D to R mail-in ballots. Based on other posts in this thread, this should not happen. This is an anomaly, and while anomalies are not always fraud, often they may point to fraud.
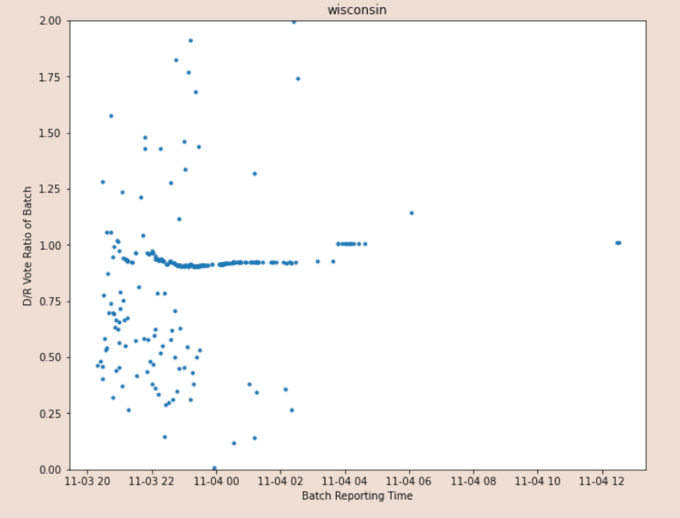
By 4am the D to R ratio was all thrown out of whack. That is because these ballots were not sampled from the real Wisconsin voter population, and they were not randomized in the mail sorting system with the other ballots. They inherently have a different D to R signature than the rest of the ballots quite possibly bc additional ballots were added to the batch, either through backdating or ballot manufacturing or software tampering. This of this being kind of analogous to carbon-14 dating, but for ballot batch authenticity.
Lets look at another anomaly (Pennsylvania):
Here is Pennsylvania's vote counting history. For the first part of the vote counting process, we see the same pattern for mail-in ballots that we've seen in every other state in the country, which is relatively stable D to R ratio that gradually drifts R as more ballots. But then as counting continues, the D to R ratio in mail-in ballots inexplicably begin "increasing". Again, this should not happen, and it is observed almost nowhere else in the country, because all of the ballots are randomly shuffled in the mail system and should be homogeneous during counting. The only exceptions to this are other suspect states that also have anomalies.
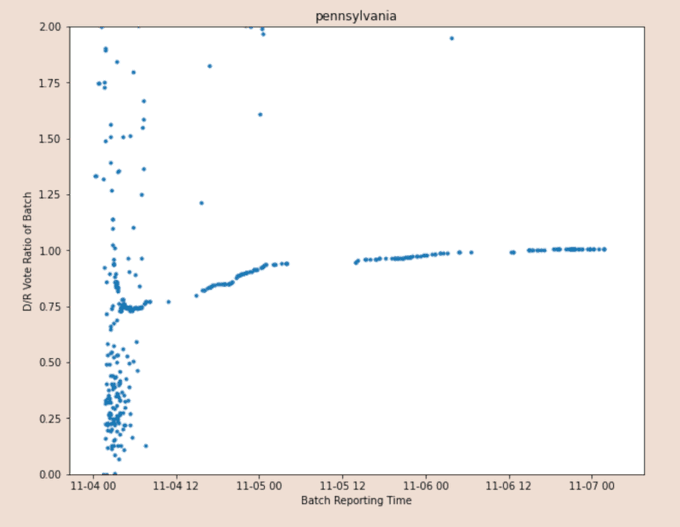
Again, this is evidence of ballot backdating, manufacturing of software tampering.
Lets look at another anomaly:
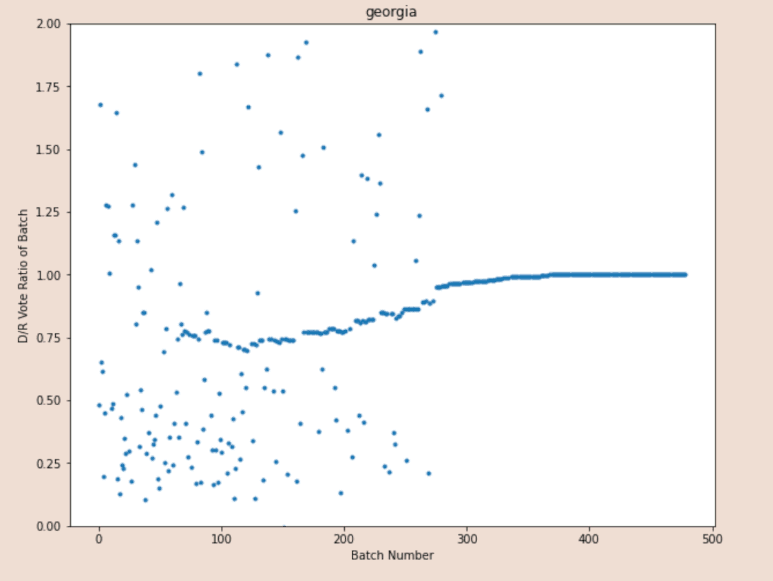
In Georgia we see pretty much the same story as Pennsylvania: increasing fractions of mail-in D ballots over time even though it defies logic and we see this pattern no where else in the country.
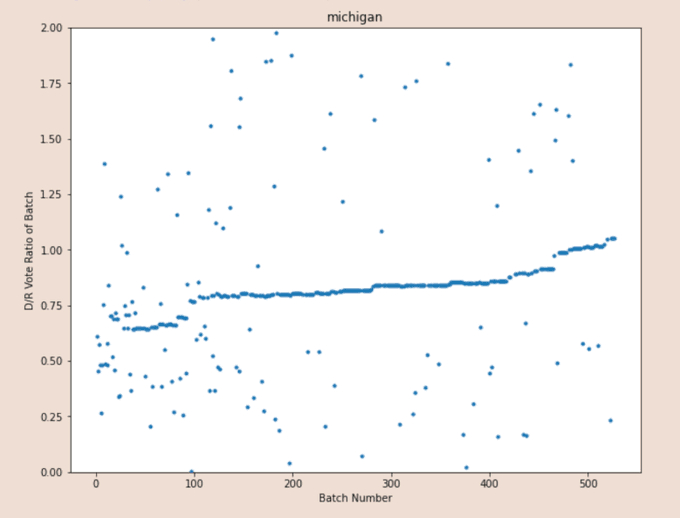
In Michigan, we see a combination of Wisconsin strangeness, together with the GA/PA weirdness. We see both signs of contaminated ballot dumping, and ballot ratios drifting toward dems when they should not be.
Virginia:
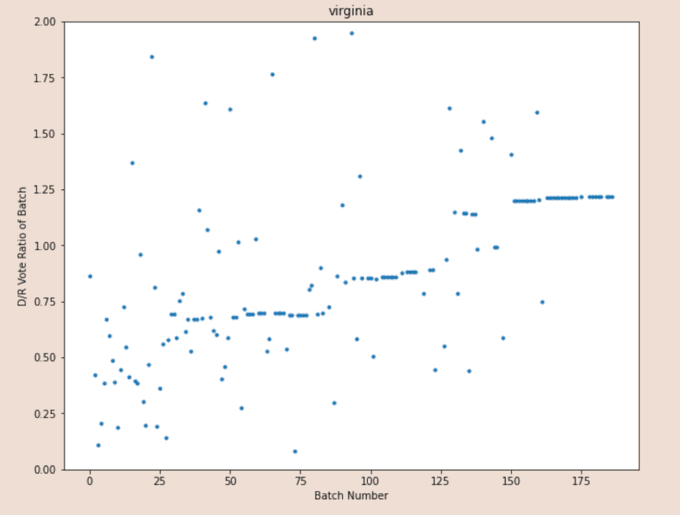
Now in fairness, VA is the only state out of the 50 that has anomalies but has not had accusations of voter fraud, yet. I think this is the exception that proves the rule. Yet to figure out what causes this anomalous shift, but here it is so no one accuses me of holding it back.
Lets wrap this up: It appears Dems shot themselves in the foot bc making everyone do mail-in ballots actually makes it easier to catch mail-in ballot fraud. Bc all of the ballots go through the postal system, they get shuffled like a deck of cards, so we expect reported ballot return to be extremely UNIFORM in terms of D vs R ratio, but to drift slightly towards R over time bc some of those ballots travel farther. This pattern proves fraud and is a verifiable timestamp of when each fraudulent action occurred.
Nenhum comentário:
Postar um comentário